Resources
The Latest

The Urban Data Center Boom Has a Monitoring Problem: Radix IoT Has the Answer
Urban data centers are converting legacy buildings into critical infrastructure—but most monitoring solutions can't handle the complexity. Here's how Radix IoT's Mango platform bridges the gap.
Read more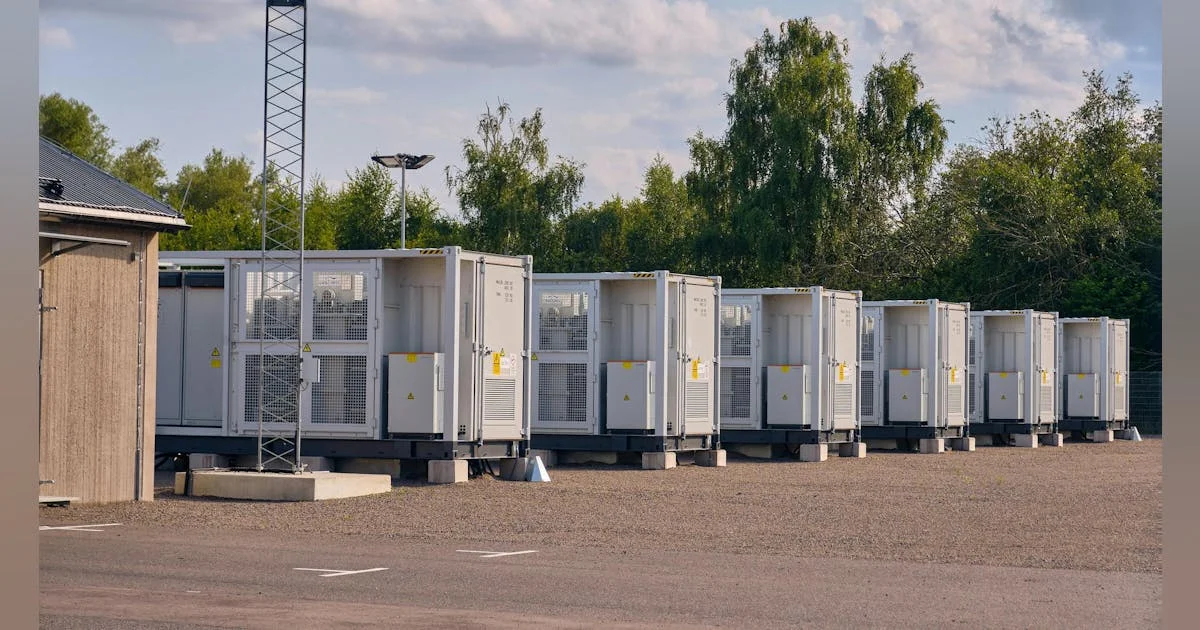
How Real-Time Monitoring Boosts Modern Microgrid Performance Efficiency
Microgrids are rising in importance for providing reliable, affordable, and sustainable energy worldwide. Real-time monitoring is the key to making them work.
Read more
IoT Predictions 2026 - The Autonomous Enterprise Era
Industry leaders including Radix IoT CEO Maury Blackman share predictions for IoT in 2026, from self-orchestrating systems to unified platforms.
Read more
Radix IoT Wins 2026 IoT Breakthrough Awards: IoT Analytics Innovation
Radix IoT recognized with the 2026 IoT Analytics Innovation Award from IoT Breakthrough.
Read more
Radix IoT Wins 2025 Tech Ascension Big Data Award: Best Data Management Solution
Radix IoT wins Best Data Management Solution for Multi-Site Infrastructure Integration at the 2025 Tech Ascension Big Data Awards.
Read more
Tackling real-world cell tower operations challenges (Reader Forum)
Radix IoT VP of Engineering Aaron Asbra examines cell tower operational challenges from alarm management and FAA compliance to 5G modernization and cybersecurity.
Read more
Now You Know Ep. 1: Mango's Scripting Power
Episode 1 of the Now You Know series exploring Mango's scripting capabilities for telecom and industrial automation.
Read more
The Hidden Infrastructure Opportunity: How Smart Hospitals Are Unlocking Operational Excellence
How integrated building systems in hospitals lead to better insight, data-driven action, and operational efficiency improvements.
Read more
Are Your Data Center Monitoring Systems Hiding Critical Energy Capacity?
How gaps in monitoring coverage can mask critical energy capacity issues in data center operations.
Read more
Radix IoT's Mango Platform Drives Unmatched Operational Efficiency at ORU and CityPlex Towers
Press release announcing the Mango deployment across 5 million square feet at ORU and CityPlex Towers.
Read more
Outages: Preventing Issues Before They Become Larger Problems
How proactive monitoring and predictive analytics help organizations prevent small issues from escalating into catastrophic outages.
Read more
The Role of Edge-To-Cloud Infrastructure in Digital Transformation
How edge-to-cloud architectures enable digital transformation for industrial and commercial operations.
Read more
Interview With Co-Founder Michael Skurla
Pulse 2.0 interviews Radix IoT co-founder Michael Skurla about the company's vision, technology, and growth trajectory.
Read more
Radix IoT Wins 2025 Best in SaaS Award
Mango platform recognized with the 2025 Best in SaaS Award by AwardChimp.
Read more
Your Infrastructure, Your Rules: Why One-Size-Fits-All IoT Security Doesn't Work
Why enterprise IoT security requires a customizable, infrastructure-specific approach rather than generic solutions.
Read more
Can DCIM's AI-Driven Future Increase Data Center Sustainability?
External publication explores how AI-driven DCIM solutions like Mango by Radix IoT can improve data center sustainability and efficiency.
Read more
Keeping Critical Facilities Running: Deep Dive with Radix IoT
Deep dive podcast with Evan Kirstel exploring how Radix IoT keeps critical facilities operational.
Read more
We're All About Connections: How Radix IoT Gets All Your Systems Talking
How Radix IoT's protocol-agnostic platform unifies data from diverse industrial systems and equipment.
Read more
Radix IoT 2025 Predictions: AI Revolution and Electricity Demand
Radix IoT's predictions for 2025 on the intersection of AI growth and electricity infrastructure demands.
Read more
Cell Tower Operations: Tackling Real-World Challenges
How IoT monitoring addresses the operational challenges of managing distributed cell tower infrastructure.
Read more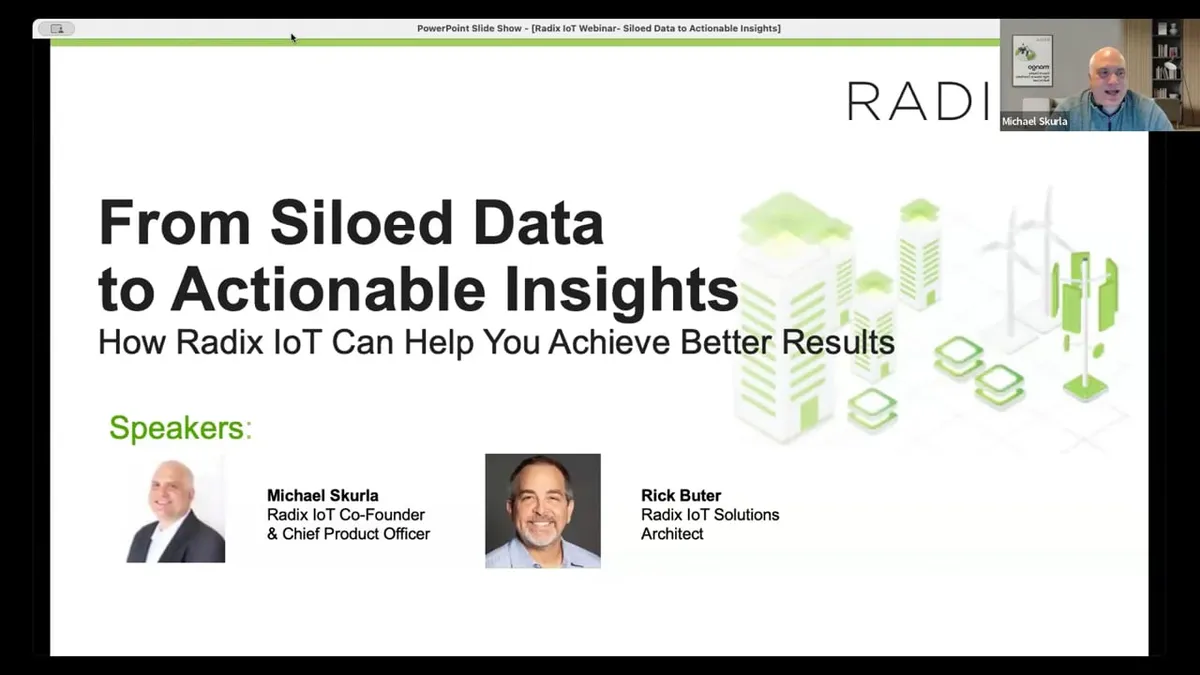
Radix IoT Webinar Recording
Recorded webinar covering the Mango platform's capabilities and real-world deployment scenarios.
Read more
Here's What You Need to Future-Proof Your AI-Ready Data Center
Industry publication examines the infrastructure requirements for AI-ready data centers, featuring Radix IoT perspectives.
Read more
From Alarm Overload to Operational Edge: Revolutionizing NOC Alarm Management
How Radix IoT helps NOC teams move from alarm fatigue to intelligent, actionable alerting.
Read more
Securing the Rapidly Evolving Smart Building Space
Practical steps for addressing cybersecurity challenges in smart buildings with converged IT/OT systems.
Read more
Radix IoT Wins IoT ThinkTank Platform of the Year and Overall Excellence Awards
Radix IoT's Mango platform wins Platform of the Year and Overall Excellence at the 2024 IoT ThinkTank Awards.
Read more
Future Proofing Your Data Center Monitoring
Video discussing strategies for building monitoring infrastructure that can adapt to changing data center demands.
Read more
Scaling Your Operations: The Two-Dimensional Challenge
Understanding the dual scaling challenges of growing both the number of data points and the number of sites in IoT deployments.
Read more
10 Companies Driving IoT, Data-Driven, Marketing Innovation
Radix IoT recognized among ten companies driving IoT and data-driven innovation across industries.
Read more
Corporate LiveWire Innovation and Excellence: Data Management Platform of the Year
Mango recognized as Data Management Platform of the Year by Corporate LiveWire Innovation & Excellence Awards.
Read more
How Microgrids and Battery Storage Redefine Energy Resilience
How microgrids and battery storage are vital to sustainable energy generation and distribution.
Read more
Battery Storage Monitoring: The Beating Heart of Modern Microgrids
Why battery storage monitoring is critical to microgrid operations and how IoT platforms enable it.
Read more
Optimize Operations With a Single Source of Truth
Podcast discussing how a unified data platform creates a single source of truth for operational decision-making.
Read more
The IoT Market: Ready for Transformation and Growth
Industry analysis featuring Radix IoT on the state of the IoT market and its growth trajectory.
Read more
7x24 Fall Show Scopes Emerging Trends in Hyperscale, Colo Data Center Sustainability, Construction, AI
Radix IoT's Luke Daiske and Michael Skurla present on 5G and NB-IoT technology for data center infrastructure at the 7x24 Exchange Fall 2024 Conference.
Read more
Radix IoT Announces the Dailenis Gonzalez Frometa Memorial Scholarship
Radix IoT establishes a memorial scholarship honoring team member Dailenis Gonzalez Frometa.
Read more
Data Centres Pushed To Breaking Point As AI Demands Surge
Ticker News interview on how AI demand is pushing data center infrastructure to its limits.
Read more
AI's Hidden Challenge: The Race to Power Tomorrow's Intelligence
The growing tension between AI compute demands and data center power infrastructure, and how monitoring helps.
Read more
How Power and Cooling Adjustments Can Drive Sustainable Data Centres
Insights on managing sustainable data centers through optimized power and cooling strategies.
Read more
Successful AI-driven Business Strategies
Publication explores successful AI-driven business strategies, featuring Radix IoT's approach to operational intelligence.
Read more
Tech Trailblazer Award Runner-Up in Two Categories
Radix IoT recognized as runner-up in two categories at the Tech Trailblazer Awards.
Read more
Build vs. Buy: Solving the Problem of Unifying Data Across Systems
When to build a custom monitoring solution vs. adopting a platform, and what to consider in the decision.
Read more
Radix IoT Promotes Key Leaders to Sustain Momentum
Strategic leadership promotions to support continued growth and innovation at Radix IoT.
Read more
Boost the Efficiency of Your Solar PV Operations with IoT Platforms
How IoT platforms can make solar PV operations more efficient through real-time monitoring and analytics.
Read more
Telecom Infrastructure: Leverage Radix IoT to Monitor and Manage Equipment
How Radix IoT integrates with existing telecom infrastructure without requiring equipment replacement.
Read more
Cell Tower Operations: How Radix IoT Helps Tackle Real-World Challenges
A deeper look at specific cell tower monitoring challenges and how Radix IoT's platform addresses them.
Read more
The IoT Data Centre: Deploying IoT to Support Growth of AI Workloads
How data centers are deploying IoT monitoring to manage the infrastructure demands of growing AI workloads.
Read more
Radix IoT Wins Digital Transformation Project of the Year Award
Recognition from Digital Revolution Awards for the South Africa water utility project partnership.
Read more
SCADA Systems: How Radix IoT Helps Get Better Performance
How Radix IoT empowers operations teams to improve the management of SCADA systems across distributed locations.
Read more
What Can Radix IoT and Mango Do For You?
A 60-second overview of how Mango unifies, analyzes, and makes operational data actionable.
Read more
A New Generation of Data Centers Spreads Use of Enterprise AI
How next-generation data centers are adopting enterprise AI, with Radix IoT perspectives on monitoring and management.
Read more
Radix IoT Named to 'The 10 Coolest IoT Software Companies 2024' List by CRN
Radix IoT recognized alongside Amazon Web Services and Microsoft on CRN's 2024 list of coolest IoT software companies.
Read more
Tech Ascension Awards: Best Big Data Analytics Solution 2024
Mango 5.1 named Best Big Data Analytics Solution at the 2024 Tech Ascension Awards.
Read more
Building Your AI Foundation: 3 Critical Components
Before jumping into AI, businesses need to ensure their operational data quality and accessibility are sufficient.
Read more
Radix IoT's Market-Leading IoT Platform Continues to Be Recognized for Data-Driven Innovation
Company momentum update highlighting industry awards, strategic hires, and event participation.
Read more
Open Architecture for DCIMs
Why avoiding vendor lock-in matters when selecting DCIM solutions for your data center portfolio.
Read more
How to Cut Down on Truck Rolls
The hidden costs of truck rolls and real-world examples of how Mango helps minimize unnecessary field dispatches.
Read more
DCS Awards 2024: Data Centre Power Distribution Unit of the Year Runner-Up
Radix IoT recognized as runner-up for Data Centre PDU of the Year at the DCS Awards 2024.
Read more
Radix IoT and Telecom: Connect Everything
Why Radix IoT's Mango platform is the preferred choice for telecommunications infrastructure monitoring.
Read more
Radix IoT In Action: Getting the Most from Legacy Systems . Facilities
How Radix IoT helps facilities management teams extend the life and value of legacy building systems.
Read more
Meet the Winners: Radix IoT
Recognition and award for Radix IoT's technology and innovation.
Read more
The Role of IoT in Driving Data-Driven Innovation
How IoT enables industrial innovation with actionable data insights that drive operational transformation.
Read more
Radix IoT DCIM Platform Bolsters Global Datacenter Performance
Announcement of enhanced DCIM capabilities for global data center monitoring and management.
Read more
What's Mango, Made Simple
A quick, clear look at what Mango is and how it turns scattered operational data into a single, actionable view.
Read more
Data-Driven Ops Deserve Better than Legacy Cellular Networks
Why legacy cellular networks fall short for modern IoT operations and how Narrowband IoT addresses the gap.
Read more
Radix IoT Wins 2024 Emerging Technology Award
Radix IoT wins the 2024 Emerging Technology Award from IoT ThinkTank.
Read more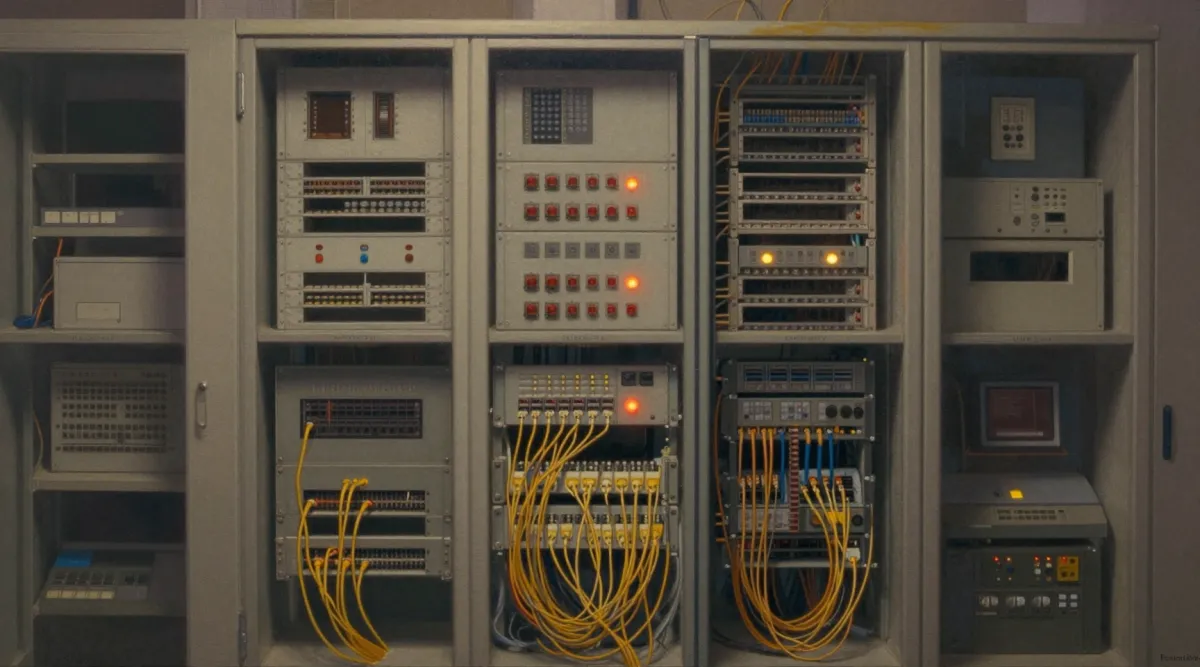
Radix IoT In Action: Getting the Most from Legacy Systems . Telecom
How telecom operators use Radix IoT to modernize monitoring across diverse legacy infrastructure.
Read more
Data Centers Evolving Landscape: Top Challenges and Opportunities
Q&A with Arieh Broide on the data center sector's evolution and how Radix IoT improves efficiency and sustainability.
Read more
Energy Evolving Landscape: Top Challenges and Opportunities
Luke Dalske discusses energy sector challenges spanning 20+ years and how Radix IoT helps mitigate risk.
Read more
Data-Driven Analytics for Modern Data Center Decision-Making
Exploring the importance of quality aggregated data and key analytics types for intelligent data center management.
Read more
Mango Monitoring Helps The London Underground Improve Passenger Experience and Safety
Real-time and historical monitoring implementation for maintenance efficiency improvements and technician safety on the London Underground.
Read more
The Greening of Data Centers: 5 Strategies for Sustainable Operations
Five practical strategies for reducing the environmental impact of data center operations.
Read more
Radix IoT Mango Platform Remains Preferred Choice Deployed Across Four Continents
Mango platform continues global expansion with deployments across six continents.
Read more
IoT Security on the Edge Is Never Absolute
Radix IoT CPO Michael Skurla examines IoT security challenges at the edge, from regulatory frameworks to the shift from prevention to detection and recovery.
Read more
Monitoring 5 Million Sq Ft in Real-Time at ORU and CityPlex Towers
Oral Roberts University and CityPlex Towers use Mango to monitor 5 million square feet of facilities in real-time.
Read more
Radix IoT in Action: Scaling Systems with Mango
How Mango can easily scale to accommodate virtually unlimited data points, and that's just the beginning.
Read more
Hyperscale Data Center Uses Radix IoT for Monitoring of Established Equipment
Using existing equipment and sensors, a hyperscale data center got a unified monitoring solution that scales with rapid expansion.
Read more
How Radix IoT Helped a Water Authority Get Real-Time Data Across Their Portfolio
A midwestern water authority deployed Mango for remote SCADA data access across a 60-mile distribution system serving five cities.
Read more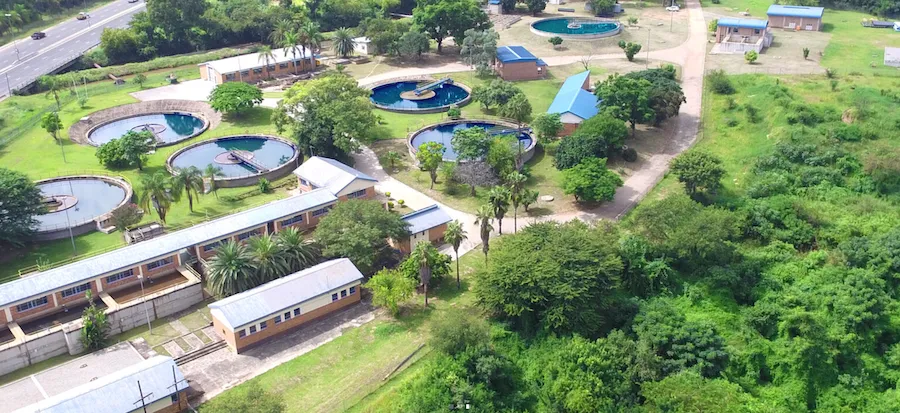
How a Water Utility Leverages Radix IoT to Deliver Safe Drinking Water
Silulumanzi Water Authority in South Africa uses Mango to serve 450,000 residents and improve water conservation efforts.
Read more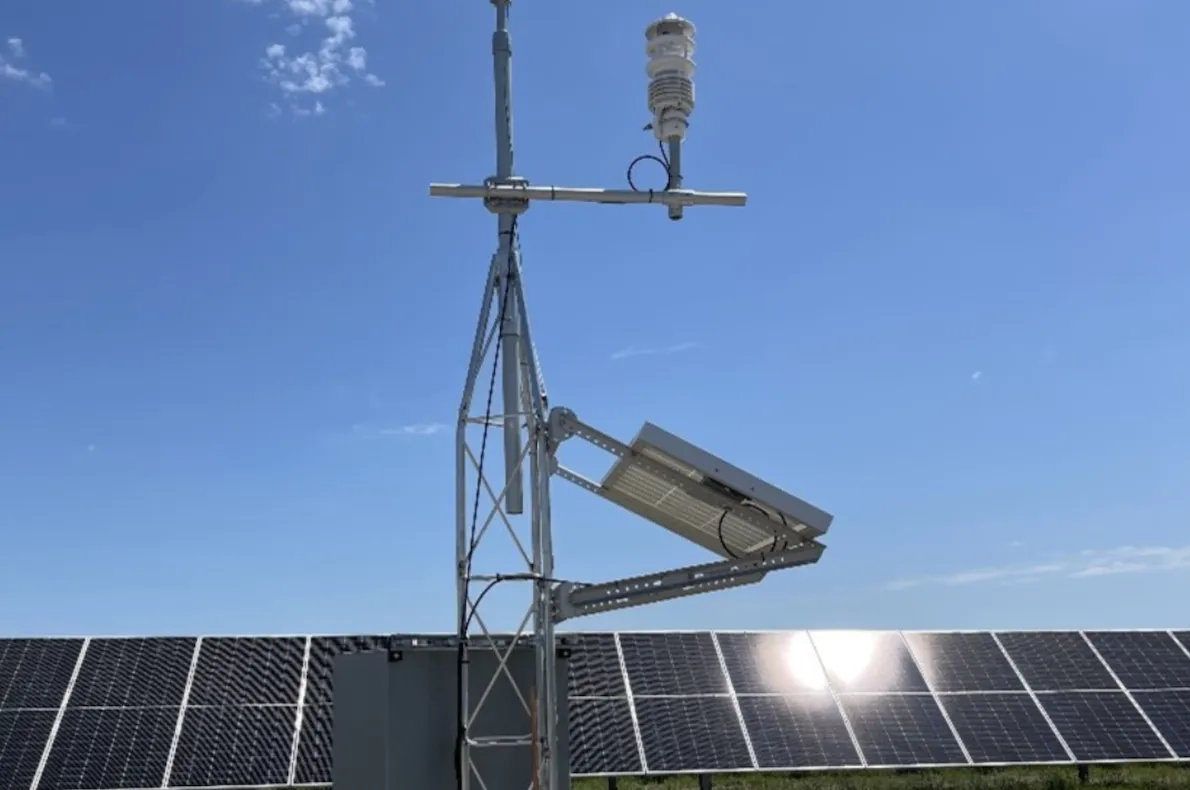
Radix IoT and REIG Empower Utility Scale Solar Customers with Analytics
Real-time and historical analytics partnership for utility-scale solar installation monitoring and management at scale.
Read more
Radix IoT 2024 Predictions: Expect a Surge in Sustainable IT Practices, Remote Work Solutions, Edge Computing, Cybersecurity, and Blockchain
Radix IoT CPO Michael Skurla forecasts five major IoT trends for 2024, from green data centers to AI-driven cybersecurity and blockchain-secured data exchange.
Read more
581: IoT's Impact on IT Professionals
Podcast featuring discussion on IoT and critical infrastructure.
Read more
Autopista Del Sol Highway Uses Mango to Keep Motorists Moving Safely
Mango by Radix IoT gathers data from tunnel and road sensing devices along the Autopista Del Sol Highway in Spain to improve safety and traffic flow.
Read more
Radix IoT Named Runner-Up at 2023 SDC Awards: SaaS Innovation of the Year
Radix IoT recognized as runner-up for SaaS Innovation of the Year at the 2023 SDC Awards.
Read more
Radix IoT Wins 2023 Think Global Awards: Tech & Entertainment
Radix IoT recognized at the 2023 Think Global Awards in the Tech & Entertainment category.
Read more
Radix IoT Wins 2023 IoT Connected Products Award: Smart Buildings Controls
Radix IoT wins the 2023 IoT Connected Products Award in the Smart Buildings Controls category from Security Sales & Integration.
Read more
A Water Management District Chose Mango for Ease of Use and Customer Service
Grays Harbor Water District moved from a problematic Windows environment to Linux and Mango by Radix IoT for controls and automation.
Read more
Radix IoT Helped a Coal Mine Gather Data to Improve Safety
Interoperating with existing systems, Mango by Radix IoT gave an open cast coal mine real-time conveyor monitoring for better maintenance and safety.
Read more
A Condominium Uses Mango to Monitor Equipment for Safety and Comfort
Sheridan Point Condominium Association monitors high-efficiency boilers with Mango to ensure proper functioning and optimal value for residents.
Read more
Radix IoT Wins Platinum at 2023 Smart Cities & IoT Innovation Awards: Most Innovative Edge Computing Solution
Juniper Research awards Radix IoT Mango OS the Platinum designation for Most Innovative Edge Computing Solution at the 2023 Future Digital Awards.
Read more
Evikontroll: Monitoring Temperature and Humidity for Timber Drying
Mango monitors temperature, humidity, and other factors essential to successful timber drying. Simple to install and easy to operate.
Read more
Radix IoT Listed in 2023 Top Solar Software and Monitoring Products
Solar Power World names Radix IoT's Mango 5 platform among the top solar software and monitoring products of 2023.
Read more
Evikontroll: Silo Control and Monitoring for Grain Drying
A large agricultural company uses Mango for monitoring and managing the delicate process of grain drying in silo systems.
Read more
Managing IoT security in smart, connected buildings
Radix IoT CPO Michael Skurla examines IoT security challenges in smart buildings, from legacy system vulnerabilities to the shift toward detection and recovery over prevention.
Read more
Purposely driven IoT becomes the norm
Radix IoT CPO Michael Skurla predicts 2023 will be a reset year for IoT, with purpose-driven outcomes replacing hypothetical use cases as big cloud pulls back.
Read more
The Demands of Interconnectivity: Radix's Assessment of the IoT Industry
IoT Evolution interviews Radix IoT CPO Michael Skurla on IoT growth drivers, the talent gap, networking trends, and notable 2022 M&A activity in the IoT space.
Read more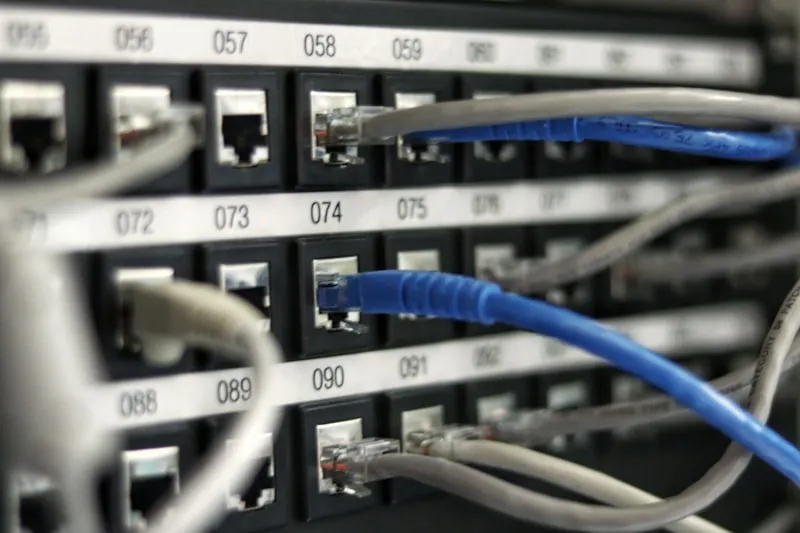
Radix IoT Wins 2022 Tech Ascension Cloud Award: Cloud Infrastructure Solution of the Year
Radix IoT wins Cloud Infrastructure Solution of the Year at the 2022 Tech Ascension Cloud Awards.
Read more
IoT Security Solutions for Critical Infrastructure
Radix IoT CPO Michael Skurla details security best practices for IoT deployments in critical infrastructure, covering edge networks, cloud services, and brownfield systems.
Read more
Optimizing the Edge: Challenges, Opportunities and the Future of Serverless
Coverage of the 'Edge at Work' panel at IoT Evolution Expo featuring Radix IoT CPO Michael Skurla discussing serverless edge computing and IoT infrastructure.
Read more
The Promise of IoT: Unlimited Actionable Data
IoT Evolution interviews Radix IoT co-founder Michael Skurla on IoT data collection challenges, remote monitoring as a post-COVID staple, and the promise of municipal mesh networks.
Read more
How Radix Scaled Up their IoT Data-Driven Decision-Making & Analytics Company
Podcast featuring discussion on IoT and critical infrastructure.
Read more
30 companies that are using software to change the world
Recognition and award for Radix IoT's technology and innovation.
Read more
Strategic partnership drives sustainability through IoT
Radix IoT and Australia-based Techstream Systems partner to expand the Mango OS IoT platform across APAC, supporting Green Star and NABERS sustainability compliance.
Read more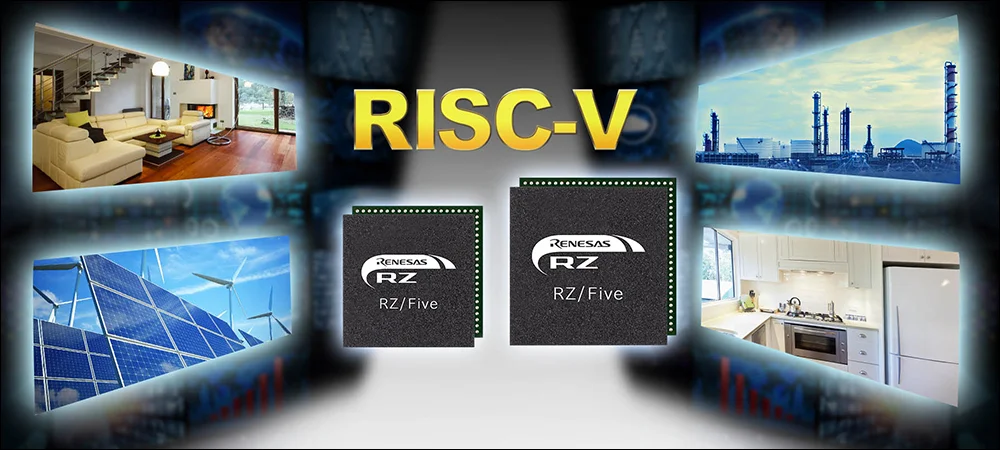
RFID News Roundup
RFID Journal covers the strategic partnership between Radix IoT and Australia-based Techstream Systems to expand the Mango OS IoT platform across the APAC region.
Read more
Fielding IoT Advantages For Field Service Technicians
External publication featuring Radix IoT perspectives and insights.
Read more
Fractured edge-gateway market starts to heat up
External publication featuring Radix IoT perspectives and insights.
Read more
Radix IoT Named Runner-Up at 2021 Tech Trailblazers Awards: IoT
Radix IoT recognized as runner-up in the Internet of Things Trailblazers Award category at the 2021 Tech Trailblazers Awards.
Read more
Ignite Marketer of the Week - Michael Skurla
Ignite Visibility profiles Radix IoT Chief Product Officer Michael Skurla, tracing his career from field engineering through IoT leadership.
Read more
Top IoT Startups of 2021
TechRound names Radix IoT among the top IoT startups of 2021, highlighting the Mango Series 4 platform for large-scale institutional IoT deployments.
Read more
Radix IoT Listed in CRN's 2021 10 Coolest IIoT Companies
CRN names Radix IoT among the 10 coolest Industrial IoT companies in its 2021 Internet of Things 50 list.
Read more
Radix IoT Wins 2021 IoT Evolution Product of the Year Award
Radix IoT's Mango OS wins the 2021 IoT Evolution Product of the Year Award from IoT Evolution World.
Read more
IoT Smart Data-Driven Manufacturing
Radix IoT CPO Michael Skurla explores how IoT platforms transform manufacturing with real-time intelligence, predictive maintenance, and data-driven decision making.
Read more
Does Your Edge Data Center Disaster Recovery Plan Include IoT Platforms?
External publication featuring Radix IoT perspectives and insights.
Read more
Radix IoT CEO Fred Dirla Wins CEO Review Global CEO Excellence Award
CEO Review names Radix IoT's Fred Dirla as Most Innovative Software Company in the Global CEO Excellence Awards.
Read more
Pandemic-Proofing and Optimizing Smart Buildings Operations
Radix IoT CTO Michael Skurla explains how IoT platforms aggregate siloed building data into unified dashboards, enabling remote management, predictive maintenance, and pandemic-proofing of commercial facilities.
Read more
7 Must-Have Features of an Edge IoT Platform
External publication featuring Radix IoT perspectives and insights.
Read more
Radix IoT and Renewable Energy Integration Group launch SCADA monitoring platform
Official announcement from Radix IoT.
Read more
How IoT Platforms Empower Distributed Portfolio Management in Critical Facilities
External publication featuring Radix IoT perspectives and insights.
Read more
Resilience was the mantra of 2020, 2021 will be the year of security
Radix IoT CTO Michael Skurla reflects on 2020's technology resilience and predicts security will dominate IoT innovation in 2021.
Read more
Edging toward remote management of edge data centers
External publication featuring Radix IoT perspectives and insights.
Read more
Radix IoT Platform Launched Through Combination of BitBox and Mango IoT
Official announcement from Radix IoT.
Read more
How Advancements in IoT Platforms Help Industrial Enterprises Flourish
Radix IoT CTO Michael Skurla discusses how IoT platforms enable data aggregation, remote monitoring, and secure integration for industrial enterprises.
Read more
Radix IoT Wins 2020 Silver Globee Award: Startup of the Year
Radix IoT wins the Silver Globee Award for Startup of the Year at the IT World Awards.
Read more
Orlando's VA Medical Center at Lake Nona updates digital infrastructure
Michael Skurla details how Orlando's VA Medical Center is consolidating siloed building systems into a unified IoT monitoring platform for improved patient experience and facility management.
Read moreNo resources match this category.